
Common Sizing Methodologies for Hydrodynamic Separators Part 2: Net Annual Sizing
In last month’s blog post, we took a look at the Point on a Curve sizing methodology. In this month’s post, we will look at the other common HDS sizing methodology: the Net Annual sizing method. As a reminder, proper sizing should start by checking local regulations.
The Net Annual method is used to determine an HDS system’s pollutant removal efficiency across a typical year’s worth of storms. To begin, one must first establish a target pollutant size (ex. 110 microns), and a target removal percentage (ex. 80%). As with the Point On a Curve method, the particle size distribution of the target pollutant is just as important as the removal percentage required.
The Net Annual sizing method uses local historic rainfall data to predict future rainfall event and the performance of the HDS system. The first step of the Net Annual approach is to gather the historic rainfall data. The data is a list rainfall event intensities paired with their respective proportions of the entire year’s worth of rainfall events. For example, according to the data used in figure 1, 7.01% of rainfall events in a given year have a rainfall intensity of 0.1 in/hr., and 5.07% of rainfall events have an intensity of 0.75 in/hr. (columns A and B).
The collected data is then used to perform an array of Rational Equations; the drainage area and Rational C factor are multiplied by each rainfall intensity to determine the flow rate for each storm within a typical year. After the flow rates have been calculated, we use the Point On a Curve method (discussed last month) to determine the removal efficiency of the HDS system at each flow rate. Finally, each the removal efficiency at each flow rate is weighted according to the corresponding proportion of the of the total yearly rainfall. The weighted removal efficiencies for each storm are added up to determine the removal efficiency of the HDS system for the entire year.
Example: In figure 1, a C factor of 0.9 multiplied 3 acres and 0.75 in/hr. equals a flow rate of 2.03 cfs (displayed in column D). According to testing data, the example HDS system removes 46% of pollutants at 2.03 cfs (column E). As mentioned above, 5.07% of rainfall events have an intensity of 0.75 in/hr., so we multiply 46% times 5.07% to determine the weighted removal efficiency for that specific storm (2.3% removal in column F). This process is performed for each storm within the collected rainfall data.
By its nature the Net Annual sizing method accounts for a lot of pollutant removal during all the smaller rainfall events. The Point On a Curve method ignores these smaller rainfall events, and is therefore more conservative than the Net Annual sizing method. While it is still an accurate measurement, the Net Annual method generally sizes smaller HDS systems than the Point On a Curve method does.
One issue to be aware of with Net Annual sizing is the absence of standardized data for manufacturers to use. Generally, rainfall data is collected and compiled independently by each HDS manufacturer. As a result, the data may vary slightly from system to system. To be sure that there are no extreme discrepancies, it may be wise to compare the data used by one manufacturer to the data used by another manufacturer.
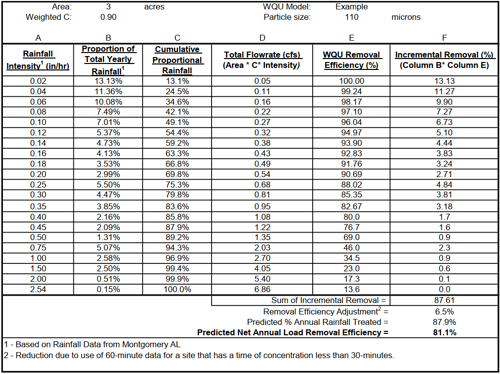
Figure 1 – Example of Net Annual Method Calculations
Many HDS manufacturers offer tools for sizing HDS systems using the Net Annual Removal method. Contech has incorporated the Net Annual Removal method into our Design Your Own Hydrodynamic Separator tool. This tool is free to use and available at www.conteches.com/DYOHDS.